What is an Organizational Chart? Types and How It Works

Download Organizational Charts PDF
Table of Contents
Ask yourself. What are some of the common challenges you face as an organization?
Suppose you are finding solutions to issues such as lack of clear communication, less productivity due to low employee engagement, and a dip in your organization’s performance. In that case, some well-defined organizational charts can assist you in dealing with such challenges.
Organizations with clearly defined structures are 3.5 times less likely to face communication issues. So, a well-defined and depicted organizational chart becomes essential for any organization as it facilitates clear communication of roles and responsibilities. It also helps streamline organizational performance by clearly mapping the company’s structure. An organizational chart is also known as a hierarchy chart.
What is an Organizational Chart?
A visual representation that depicts the ranks and positions of all the members in a company in a diagram format is known as an organizational chart. It shows how the organization is structured by highlighting various professional relationships within a business through different shapes and lines.
A shape like a rectangle symbolizes a position, while lines like dotted or dashed lines map the reporting lines between various positions. For example, a vertical line extending from the top down signifies hierarchy, while a horizontal line represents cross-functional collaboration between individuals and departments.
Such a chart is critical for any business, regardless of size or sector. A well-defined chart must represent organizational relationships in manufacturing, healthcare, technology, and retail.
They correspond to different structures, such as hierarchical, functional, divisional, and matrix structures. We’ll explore these types of organizational structures in detail.

Why are Organizational Charts Important in the Workplace?
An organizational chart is essential for a workplace for several reasons. It helps clearly define the roles and responsibilities. It also improves decision-making by establishing clear lines of communication, thus increasing an organization’s overall efficiency.
Clear Role Definition
These charts visually map the roles and responsibilities within an organization. When team members understand their duties, roles, and relationships to the business outcomes and who they report to, achieving the business outcomes becomes easier. A well-defined organizational structure increases productivity and contributes to job satisfaction. 70% of employees say that role clarity improves job satisfaction.
Improved Communication and Decision-Making
Companies with clear communication structures are 25% more productive. This organizational chart depicts the lines of communication, preventing potential bottlenecks and resulting in effective communication.
These charts also outline the scope of different authorities in an organization. This facilitates quicker and improved decision-making. A streamlined decision-making process increases an organization’s competitiveness by facilitating timely decisions.
Increased Efficiency
A clear and comprehensive visual mapping of an organization’s structure increases efficiency and reduces overlaps and duplications. Organizations with clearly defined structures are 15% more efficient in task completion.
Easier Onboarding
They help recruits understand their responsibilities, reporting lines, and relative organizational positions, improving their overall onboarding experience. An effective onboarding software improves retention by 82%.
Supports Business Growth
Effective depiction of an organizational chart flow aids in restructuring and goal alignment. Comprehensive mapping of employee roles and their departments helps in understanding cross-functional collaborations and departmental bottlenecks. This facilitates a more detailed evaluation of employees’ domain expertise and helps restructure departments if necessary.
They also help clearly represent the relations between all the organizational levels and positions by using different shapes and lines. This helps in effective goal alignment while supporting business growth.
Helps in Workforce Planning
Such a chart helps in finding performance gaps and planning recruitment. It provides an overview of a department’s functions, helping identify overlapping responsibilities. Also, by showing the headcounts of each department, this chart assists in workforce planning. 60% of HR managers use organizational charts for talent planning.
Enhances Transparency and Accountability
Such charts also clarify roles and responsibilities associated with a specific position, department, or task. By doing this, it facilitates a transparent and accountable workplace.
Facilitates Change Management
It plays a particularly significant role in change management. Mapping out the organization’s different structures and departments helps facilitate smoother restructuring during mergers and acquisitions (M&As).
In restructuring, it assists in assigning roles and responsibilities to employees and departments based on their functions and responsibilities. In M&As, a chart depicting the organization helps redefine roles, restructure departments, and streamline operational integrations by outlining the new departments. 70-90% of M&As fail to achieve their anticipated goals due to integration and unclear organizational structures.

Types of Organizational Structures
Hierarchical Organizational Structure
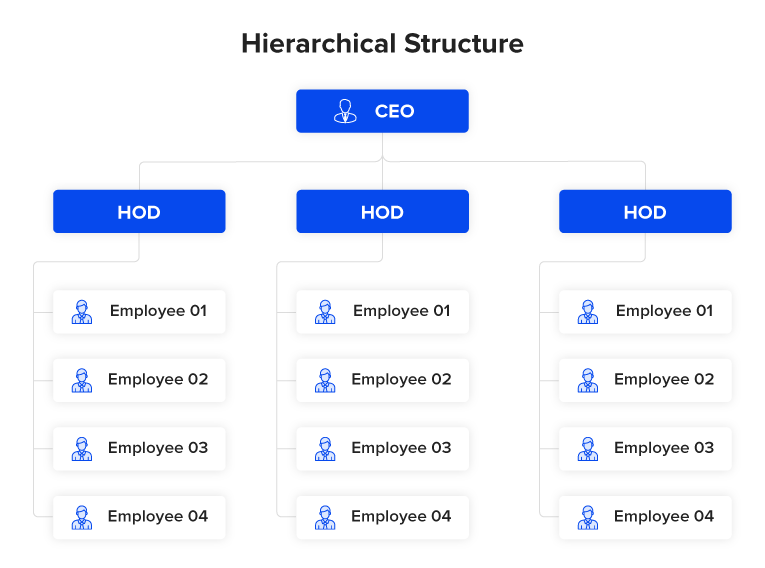
A hierarchical organizational structure is a pyramid-shaped structure. It is also one of the traditional structures. Its primary purpose is to establish a clear chain of authorities. It is ideal for large-scale organizations such as large businesses or government organizations. In this structure, employees are grouped in a department/team that reports to a manager. Such groups can be formed based on various factors, such as functions, products, or departments, e.g., sales or HR.
Matrix Structure
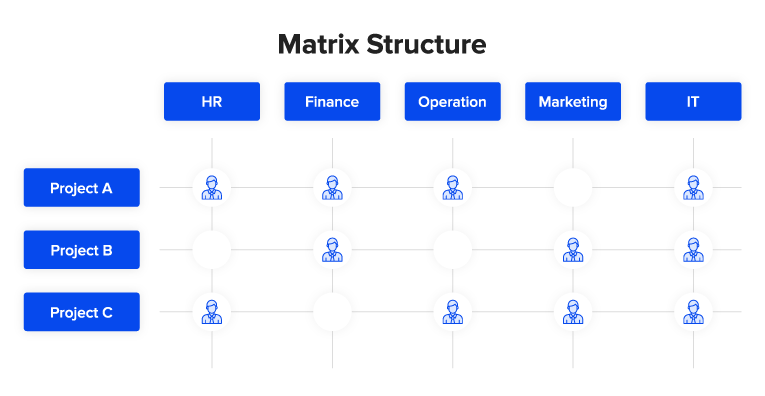
A matrix organizational structure establishes dual reporting relationships. The reporting structure is depicted in grids or matrixes, where employees with similar functional expertise are grouped together. Employees report to more than one manager. For example, an employee in the sales department would also report to the head of the marketing department. This model is also known as solid-line and dotted-line reporting. A matrix organizational structure is ideal for cross-functional collaborations and MNCs.
Flat Organizational Structure
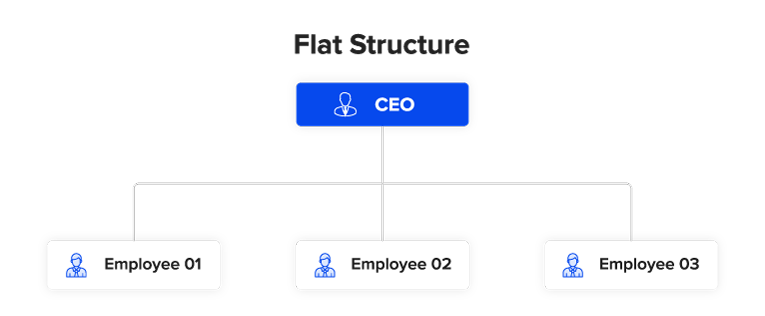
This structure is mainly different from others in that it distributes decision-making powers to employees by eliminating middle managers. However, employees do report to their superiors in command. It is ideal for small businesses or start-ups and is also known as a team-based structure.
Divisional Organizational Structure
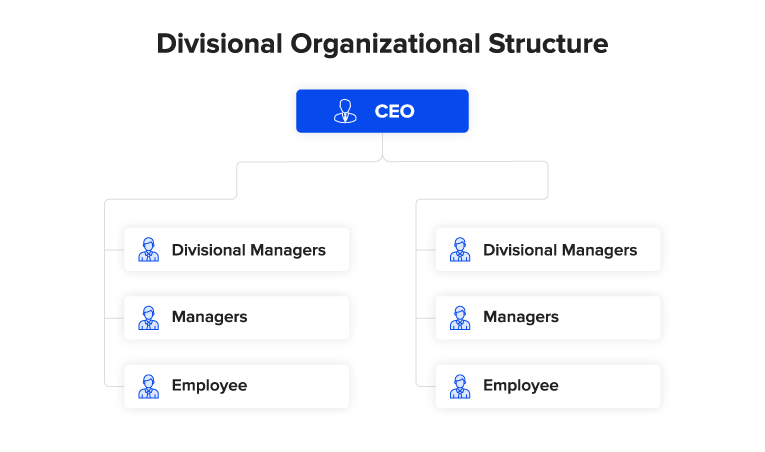
Divisional structures represent different divisions/sub-divisions of an organization. For example, various divisions could be based on products, regions, and markets.
Each division is a small leadership group in its own right. For instance, a multinational corporation (MNC) comprises various branches, each led by different leaders, such as the HR manager and CEO, and other essential roles. For this reason, a divisional structure is ideal for large MNCs.

How do I Create a Hierarchy Chart?
You need to understand your needs, collect relevant information, and have a proper plan for updating your chart. Here’s a step-by-step process for creating an effective chart of your organization.
Set a Scope
Define the departments, teams, and regions of your organization. Consider your organizational chart. Understand your organization’s functioning and, based on that, choose a structure like a hierarchical, matrix, or other customized framework.
Collect Information
Collect information about your organization’s roles and responsibilities, job profiles, and reporting lines. Automated software could help you save time in doing this. 45% of companies use automated human resource software to gather and analyze data.
Create Your Chart Based on Your Decision
Create a chart using any of the popular tools like Pingboard or Microsoft Visio. Prefer the structure that best fits your organization. It could be your own customized structure based on the different types of organizational structures mentioned above. Again, a well-defined organizational structure is critical to your organization’s functioning.
Make a Plan to Update
If you want to update your chart manually, have a proper plan. You could also prefer tools such as Microsoft Visio or similar tools. Such tools would help you update your chart by integrating it with your existing facilities.

The Bottom Line
Implement a well-structured onboarding process, clearly defined roles, and plans for business continuity and talent management with comprehensive and updated charts. Make the most of your chart by utilizing different structures. A well-defined chart of an organization can be an excellent tool for driving the overall growth of your business.
What is the Most Popular Organizational Chart?
The most commonly used organizational chart is a hierarchical one. Its pyramid-shaped structure helps establish clear lines of command. According to Forbes.com, 85% of large organizations prefer hierarchical charts.
What is an Organizational Chart in HR?
It refers to HR using organizational charts to evaluate growth, understand roles, and implement workforce planning strategies. Sixty percent of HR teams use these charts for succession planning.
How to Choose the Right Organizational Chart?
Choosing the right chart includes –
- Setting a scope,
- Reviewing different organizational structures,
- Collecting and analyzing information related to your organization,
- Creating an organization chart with your preferred tool.


Grow your business with factoHR today
Focus on the significant decision-making tasks, transfer all your common repetitive HR tasks to factoHR and see the things falling into their place.

© 2026 Copyright factoHR