30+ Data Analyst Interview Questions and Answers (2026)

Table of Contents
A career as a data analyst is in high demand today, but preparing for interviews can feel stressful, especially if you’re just starting out.
This guide helps you prepare for data analyst interview questions with simple answers for both freshers and experienced candidates. It also includes a Last-Minute Interview Preparation Checklist to help you revise quickly before your interview.
Key Takeaways
- 30+ Data Analyst Questions to help freshers and experienced candidates prepare effectively.
- Questions are grouped by category, making preparation easier and more organized.
- Learn how to structure clear and confident answers with relevant examples.
- Your Last-Minute Checklist to quickly review important points before your interview.

Data Analyst Interview Questions for Freshers
This section helps freshers learn common data analyst questions with simple answers.
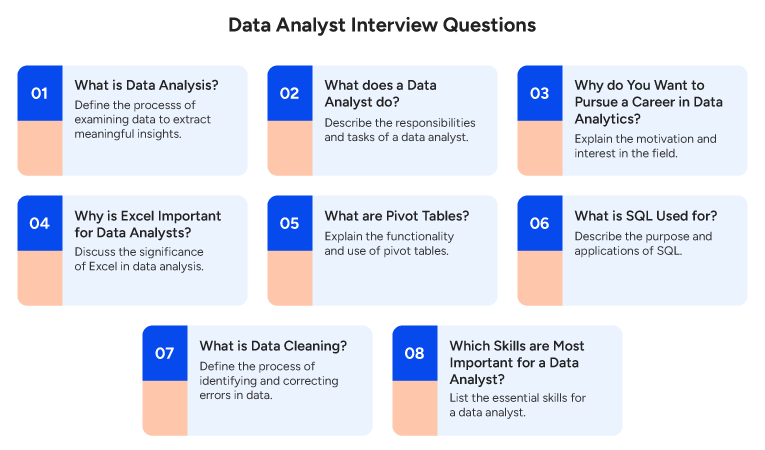
1. What is Data Analysis?
Why They Ask:
This question helps interviewers assess if the candidate understands the core concept of data analysis and can explain it clearly.
How to Answer:
Give a simple definition of data analysis and why organizations need to analyze data.
Sample Answer
Data analysis is basically a process of analyzing, modeling, and interpreting data from multiple sources to identify patterns, trends, and valuable insights. It helps organizations understand their current market position, identify problems, and make informed decisions for improvement.
2. What does a Data Analyst do?
Why They Ask:
Interviewers may ask this question to gauge the candidate’s understanding of a data analyst’s roles and responsibilities.
How to Answer:
Explain how a data analyst role impacts and benefits organizations.
Sample Answer
A data analyst collects and studies data to help companies make informed decisions. They gather data from different sources, filter and organize it, and search for patterns or trends. They present and forecast their findings clearly so teams can improve performance or solve business issues.
3. Why do You Want to Pursue a Career in Data Analytics?
Why They Ask:
Interviewers ask this to understand the candidate’s motivation and interest in the field.
How to Answer:
Focus on a genuine interest in working with data and solving problems.
Sample Answer
I want to pursue a career in data analytics because I genuinely enjoy working with data and solving problems. I like looking at data, finding patterns, and understanding what it actually means. When those insights help a business make better decisions, it feels very satisfying. I also like that this field keeps changing, so I get to learn and improve my skills continuously.
4. What is Structured and Unstructured Data?
Why They Ask:
Interviewers ask this question to assess the candidate’s basic understanding of data types, how data is organized and handled in real-world situations.
How to Answer:
Briefly Explain both Data Types with Simple Examples.
Sample Answer
Structured data is well-organized data stored in tables, spreadsheets, or databases, which makes it easy to search and analyze, such as customer details or sales records. Unstructured data does not follow a fixed format and includes things like emails, images, videos, and social media content, which are harder to analyze using traditional tools.
5. Why is Excel Important for Data Analysts?
Why They Ask:
Interviewers want to assess whether the candidate understands the importance of using Excel for data analysis, especially in entry-level roles.
How to Answer:
Explain that Excel helps organize, analyze, and summarize data easily.
Sample Answer
Excel is essential for data analysts because it helps organize and clean large datasets, perform calculations, and spot trends quickly using various tools, functions, and formulas. It is cost-effective and widely available, which makes it easy to use for preliminary analysis before deeper investigations with more complex tools.
6. What are Pivot Tables?
Why They Ask:
This question tests the candidates’ familiarity with tools for summarizing data.
How to Answer:
Describe the function and usage of pivot tables in data analysis as a way to summarize and reorganize data.
Sample Answer
Pivot tables are used to quickly summarize and analyze large amounts of data in tools like Excel or Google Sheets. They help organize data by grouping it into rows and columns so patterns and totals are easy to see. I can use pivot tables to calculate values like totals, averages, or counts for different categories. Since they work with drag-and-drop, they make reporting fast and easy without complex formulas.
7. What is SQL Used for?
Why They Ask:
Interviewers ask this to assess whether the candidate understands the process of accessing data from databases.
How to Answer:
Give a simple explanation of SQL and its purpose.
Sample Answer
SQL (Structured Query Language) is used to access, manage, and manipulate data stored in relational databases. Data analysts use SQL to retrieve specific information using SELECT statements, combine data from multiple tables using JOINs, filter records with WHERE clauses, and perform calculations and groupings with functions like SUM, COUNT, and GROUP BY.
8. What is Data Cleaning?
Why They Ask:
Interviewers ask this to check if the candidate understands the importance of preparing data before analysis.
How to Answer:
Explain data cleaning as the process of fixing errors and removing unwanted data.
Sample Answer
Data cleaning is the process of identifying and removing misleading or inaccurate records from the datasets. The primary objective of data cleaning is to improve data quality so it can be used for analysis and predictive modeling. It is the next process after data collection and loading.
9. What is Data Validation, and how do You Check Data Accuracy?
Why They Ask:
This question helps interviewers understand whether the candidate knows how to maintain data quality.
How to Answer:
Briefly define data validation and explain common methods for checking accuracy.
Sample Answer
Data validation is the process of checking whether data is accurate, complete, and usable before analysis. Analysts verify data types, ranges, and formats to ensure that values conform to predefined rules. Accuracy is checked by comparing data against source records and identifying inconsistencies, which helps maintain data integrity and prevents errors.
10. What is Data Visualization?
Why They Ask:
Interviewers want to check whether candidates can clearly explain data insights to others.
How to Answer:
Explain data visualization as the presentation of data in a visual format to make information easier to understand.
Sample Answer
Data visualization is the practice of presenting data using charts, graphs, or other visual representations to make information easier to understand. It helps identify patterns, trends, comparisons, and outliers quickly. Effective visualization relies on clean data, choosing the correct chart for the message, and keeping the design uncluttered.

11. Which Chart is Best for Trend Analysis?
Why They Ask:
This question tests the candidates’ knowledge of charts and their use.
How to Answer:
Explain which chart is most suitable for showing trends and briefly mention why it works well for time-based or continuous data.
Sample Answer
A line chart is best for trend analysis because it shows how values change over time. It makes it easy to spot patterns such as upward or downward movement, seasonality, or sudden changes. This helps analysts and stakeholders quickly understand how performance is evolving.
12. What Skills do You Think are Most Important for a Data Analyst?
Why They Ask:
This question checks whether the candidate understands the core skills needed for the role.
How to Answer:
Mention a mix of analytical, communication, and basic technical skills.
Sample Answer
Important skills for a data analyst include strong problem-solving, attention to detail, and the ability to identify patterns in data. Communication skills are essential for clearly explaining insights and supporting decision-making. Proficiency in data cleaning and data visualization, as well as basic programming/scripting, is also important for solving real-world problems.
13. What have You Learned Recently to Improve Your Data Analysis Skills?
Why They Ask:
Interviewers want to assess the candidate’s curiosity and commitment to learning and growth, both of which are important for entry-level candidates.
How to Answer:
Mention a recent learning activity, such as practice, courses, or self-study. Keep it practical.
Sample Answer
Recently, I completed an online course on exploratory data analysis, which helped me approach data more systematically before analysis. I attended a webinar on building dashboards, learning to choose visuals based on audience and goals. I practiced applying these concepts to sample datasets to reinforce what I had learned.
Data Analyst Interview Questions for Experienced Candidates
This section covers some common data analyst interview questions and answers for experienced candidates.
14. How do You Ensure Data Accuracy in Your Analysis?
Why They Ask:
Interviewers ask this question to understand how candidates prevent errors when working with business-critical information.
How to Answer:
Explain the specific checks you perform at different stages, and how you reduce the risk of incorrect insights being shared with stakeholders.
Sample Answer
I ensure accuracy by validating data at multiple stages of the analysis process. I begin by checking for missing values, then cross-verify key metrics against source systems or existing reports to confirm their reliability. Before sharing results, I review assumptions, calculations, and outputs to ensure the insights align with the business context and are accurate.
15. How do You Find and Fix Data Quality Issues?
Why They Ask:
This question helps interviewers assess the candidate’s experience handling raw or unreliable data.
How to Answer:
Describe how you identify common data issues and explain the steps you take to correct or manage them.
Sample Answer
I start by profiling the data to identify missing values, then clean it by correcting formats, removing duplicates, handling missing values appropriately, and validating value ranges. If assumptions or adjustments are required, I document them clearly so the analysis remains transparent and trustworthy.
16. What is Data Wrangling?
Why They Ask:
Interviewers ask this question to determine whether the candidate understands the basic preparation required before proper analysis can begin.
How to Answer:
Define data wrangling and explain its importance in real analytical projects.
Sample Answer
Data wrangling is closely related to preprocessing and is also known as data munging. It involves cleaning, transforming, and organizing raw or unstructured information into a format suitable for analysis. The main objective is to improve the quality and structure so it can be effectively used for reporting, analysis, or model building.
17. How do You Handle Large Datasets Efficiently?
Why They Ask:
Interviewers want to know whether the candidate can handle large volumes of data without delaying analysis or systems.
How to Answer:
Explain how you optimize performance through filtering, summarization, and structured processing.
Sample Answer
When working with large datasets, I focus on filtering data early to include only relevant columns and time periods. I summarize data before analysis, avoid unnecessary calculations, and break the work into smaller, manageable steps. This approach improves performance and keeps the evaluation focused on business goals.
18. How do You Turn a Business Problem into a Data Problem?
Why They Ask:
This question helps interviewers know if the candidate can turn business goals into clear questions that data can answer.
How to Answer:
Explain how you clarify objectives, identify metrics, and define the scope of analysis.
Sample Answer
I begin by understanding the business objective and the decision to support. I then break the problem into specific questions that can be addressed through analysis, such as identifying trends, gaps, or changes in performance over time. This helps define the right metrics, data sources, and scope before the analysis begins.
19. How do You Decide which Data is Important for Analysis?
Why They Ask:
Interviewers ask this to assess whether the candidate can prioritize relevant data.
How to Answer:
Explain how relevance, quality, and business impact guide your selection.
Sample Answer
I focus on data that is directly relevant to the problem being analyzed. I consider factors such as relevance, time period, data accuracy, and potential impact on decision-making. Any data that does not add value to the objective is excluded to keep the analysis efficient and clear.
20. Can You Explain a Time when Your Analysis Influenced a Business Decision?
Why They Ask:
This question helps interviewers assess how the candidate’s work has contributed to business outcomes.
How to Answer:
Share a concise example that includes the problem, your analysis, and the outcome.
Sample Answer
In a previous role, I analyzed customer behavior data and identified a drop-off point in the sales funnel. Based on these insights, the team revised the onboarding flow and messaging. This change improved conversion rates and demonstrated how data-driven insights can support better business decisions.

21. How do You Ensure Insights are Helpful in Business Teams?
Why They Ask:
Interviewers want to know whether the candidate’s analysis leads to action or just reports.
How to Answer:
Explain how you align insights with business goals and present them clearly.
Sample Answer
I ensure insights are helpful to business teams by first aligning them with specific business goals and priorities. I present findings with visuals, so the team can quickly understand the key points. I also highlight actionable recommendations, explaining how the insights can guide decisions or improve processes. I also take feedback from stakeholders and follow up to see how the insights are applied.
22. How do You Explain Data Results to Non-Technical Stakeholders?
Why They Ask:
This question evaluates the candidate’s ability to communicate complex information clearly.
How to Answer:
Describe how you simplify results and use visuals.
Sample Answer
When explaining data results to non-technical stakeholders, I avoid technical jargon and focus on the key insights that matter to the business. I use simple charts to highlight trends rather than detailed calculations. I also relate the findings to real business outcomes, so the impact is clear. This helps ensure the message is easy to understand and supports confident decision-making.
23. How do You Use SQL Joins in Real Projects?
Why They Ask:
Interviewers ask this to assess the candidate’s practical experience combining data from multiple tables.
How to Answer:
Provide a real-world example of when and why you use joins.
Sample Answer
SQL joins are used in real projects to combine data from multiple tables, for example, I use INNER JOINs to create customer-order reports that show only customers with completed orders. LEFT JOINs are helpful to complete the customer list with order details, even for customers who have not placed orders. RIGHT JOINs, or FULL OUTER JOINs, are used in scenarios such as product-supplier or employee-department reporting, where it is important to include all records from one or both tables to provide a complete business view.
24. What is the Difference between WHERE and HAVING?
Why They Ask:
This question tests the candidate’s understanding of SQL filtering logic.
How to Answer:
Explain how each clause works and when it is applied.
Sample Answer
The main difference between WHERE and HAVING is that WHERE filters individual rows before grouping or aggregation, while HAVING filters grouped results after aggregation. The WHERE clause is used for row-level conditions and cannot be used with aggregate functions directly. In practice, WHERE is used to limit the data early, and HAVING is used to refine aggregated results.
25. How do You Improve Slow SQL Queries?
Why They Ask:
Interviewers want to know whether the candidate can optimize query performance.
How to Answer:
Explain the techniques you use to identify and fix performance issues.
Sample Answer
I improve slow queries through several optimization techniques. First, I add indexes on columns frequently used in WHERE clauses, JOIN conditions, or ORDER BY statements to speed up data retrieval. I avoid using SELECT * and instead specify only the columns needed. I review the query execution plan to identify bottlenecks, such as full-table scans or inefficient joins. Breaking complex queries into smaller stages using temporary tables or CTEs can also improve readability and performance.
Data Analyst Interview Questions on Python, Excel, and Analytics Tools

26. When do You Choose Python Instead of Excel?
Why They Ask:
This question evaluates the candidate’s ability to choose the right tool for the task.
How to Answer:
Compare use cases clearly and practically.
Sample Answer
Python is ideal for automation and building consistent, reusable workflows; tasks that would require manual effort in Excel can be scripted and scheduled in Python. I also prefer Python for complex statistical analysis, machine learning, and advanced data transformations beyond Excel’s built-in functions. Python libraries like pandas, NumPy, and scikit-learn provide powerful capabilities for data manipulation and predictive modeling.
27. What tools are Commonly Used for Data Analysis?
Why They Ask:
Interviewers ask this to understand the candidate’s familiarity with the analytics ecosystem.
How to Answer:
Mention commonly used tools and their purposes.
Sample Answer
Commonly used data analysis tools include Excel and SQL for data cleaning, exploration, and querying structured data. Programming languages such as Python or R are used for deeper analysis, automation, and statistical modeling. Visualization tools like Tableau or Power BI help present insights in a clear and visual format for stakeholders. The choice of tools usually depends on the data size, complexity, and project business requirements.
28. How do You Stay Updated on New Data Tools and Trends?
Why They Ask:
This question assesses the candidate’s learning mindset and adaptability.
How to Answer:
Explain how you actively upgrade your skills.
Sample Answer
I stay up to date by regularly reading industry blogs and trusted analytics publications. I also attend webinars and online sessions to understand how new tools and techniques are being applied in real projects. Participating in analytics communities helps me learn from peers and practical use cases. In addition, I experiment with new tools on sample or real datasets to build hands-on understanding rather than just theoretical knowledge.
29. What Steps do You Follow to Analyze a Dataset?
Why They Ask:
Interviewers ask this question to understand the candidate’s overall analytical approach.
How to Answer:
Explain the process from problem understanding to delivering insight.
Sample Answer
I begin by understanding the business problem and the questions that need to be answered. I then collect relevant data and clean it to handle missing values, errors, and inconsistencies. Next, I perform exploratory data analysis to identify patterns, trends, and key drivers. Finally, I use clear visuals and explanations to present insights so stakeholders can easily understand the findings and take action.
30. What is the Importance of Exploratory Data Analysis (EDA)?
Why They Ask:
This question checks whether the candidate understands the value of early data exploration.
How to Answer:
Explain how EDA helps guide deeper analysis.
Sample Answer
Exploratory data analysis is important because it helps understand the structure and behavior of the data early on. It allows analysts to identify trends, relationships, and anomalies that may not be obvious at first glance. EDA also helps detect data quality issues such as missing values or outliers, before deeper analysis begins. This early understanding guides the choice of analytical methods and improves the accuracy and reliability of the final results.

31. What is the Difference between Descriptive and Predictive Analysis?
Why They Ask:
Interviewers use this question to assess the candidate’s understanding of analytical approaches.
How to Answer:
Clearly differentiate between past-focused and future-focused analysis.
Sample Answer
Descriptive analysis focuses on understanding past events by summarizing historical data. It explains what happened, identifying patterns, trends, and relationships through aggregation, visualization, and basic statistics. Predictive analysis builds on this historical data to forecast future outcomes. It relies on methods like regression, time series analysis, and machine learning. It’s used for tasks like product recommendations and predicting patient risk, playing a key role in data-driven decision-making.
32. What are Univariate, Bivariate, and Multivariate Analyses?
Why They Ask:
This question tests the candidate’s understanding of the levels of statistical analysis.
How to Answer:
Define each type clearly with an example.
Sample Answer
Univariate analysis focuses on a single variable and is used to describe its distribution, such as average sales or age distribution. Bivariate analysis examines the relationship between two variables, for example, how price changes affect sales. Multivariate analysis examines multiple variables together to identify patterns and dependencies, such as how price, marketing spend, and seasonality jointly influence revenue.
Behavioral Interview Questions for Data Analysts
33. Why Should We Hire You for this Data Analyst Role?
Why They Ask:
Interviewers ask this to evaluate fit, confidence, and value addition.
How to Answer:
Highlight your skills, experience, and business impact.
Sample Answer
I merge analytical skills and practical business understanding into the data analyst role. Along with working confidently with data and tools, I focus on clear communication and collaboration with different teams. I am careful about data accuracy and take ownership of my work. This approach ensures that analysis is practical, trusted, and supports real business decisions.
34. How do You Prioritize Multiple Data Requests?
Why They Ask:
This question assesses the candidate’s time management and planning skills.
How to Answer:
Explain how you evaluate urgency and impact.
Sample Answer
When handling multiple data requests, I first assess the urgency and potential business impact of each. I also consider dependencies, such as whether one analysis is required before another can move forward. Based on this, I establish a clear execution order and set realistic timelines. Throughout the process, I keep stakeholders informed about progress and any changes to delivery expectations.
35. How do You Handle Feedback on Your Analysis Work?
Why They Ask:
Interviewers want to understand how the candidate responds to feedback and opportunities for improvement.
How to Answer:
Show openness and professionalism.
Sample Answer
I listen carefully to feedback, clarify expectations, and make revisions where needed. Feedback helps improve the quality and usefulness of my analysis.
36. Which Part of Data Analysis do You Enjoy the Most, and why?
Why They Ask:
This question helps interviewers understand a candidate’s motivation.
How to Answer:
Connect your interest to business impact.
Sample Answer
I enjoy the stage where raw data is explored, and patterns start to emerge. This is where numbers begin to explain the actual business scenario and highlight opportunities or risks that may not be obvious. It motivates me to turn these findings into clear insights that teams can understand and utilize. When data directly supports better decisions and outcomes, it is most rewarding.
Data Analyst Interview Questions on Project Scenarios

37. How Would You Analyze a Sudden Drop in Sales?
Why They Ask:
Interviewers ask this to evaluate structured problem-solving skills.
How to Answer:
Explain your step-by-step diagnostic approach.
Sample Answer
If there is a sudden drop in sales, I first validate the data to rule out reporting errors or data quality issues. Once the numbers are confirmed, I segment sales by product, region, and customer group to pinpoint where the decline is occurring. I then review internal factors and assess external factors to identify the root cause and suggest corrective actions.
38. Tell Me about a Complex Data Analytics Project You Worked on.
Why They Ask:
This question helps interviewers assess project ownership and the ability to handle complexity.
How to Answer:
Describe the problem, tools used, and results.
Sample Answer
I worked on a customer churn analysis project that required combining data from sales, customer support, and product usage systems. The challenge was handling different data formats and ensuring consistency across sources before analysis. I used analytical tools to identify churn patterns and key risk indicators, including usage drop-offs and recurring support issues. These insights helped the business design targeted retention strategies, leading to a 12% reduction in customer churn.
39. How do You Design Dashboards for Management?
Why They Ask:
Interviewers want to assess the candidate’s ability to support decisions through visualization.
How to Answer:
Explain your strategy for selecting metrics and designing visuals.
Sample Answer
I categorize the dashboard based on the use case, whether operational, strategic, or KPI-driven, and choose metrics that reflect performance, progress, and risk. I keep visuals clear and consistent by using appropriate charts, logical layouts, and simple labels to highlight trends and patterns at a glance. I also update dashboards in real time so management can review performance.
40. What Will You do if the Data You Receive Looks Wrong or Incomplete?
Why They Ask:
Interviewers ask this question to evaluate a candidate’s troubleshooting and communication skills.
How to Answer:
Explain how you validate and escalate issues.
Sample Answer
If the data looks wrong or incomplete, I first check the source to make sure it was collected correctly. Then, I compare it with related data to find where the issue might be coming from. I look for missing values, mismatched numbers, or formatting problems that could affect the results. If I find any issues, I write them down clearly and explain how they might impact the analysis. Finally, I communicate with the right team and help fix the problem before moving forward.
41. Tell Us about a Data Project that Helped Your Team or Company
Why They Ask:
Interviewers ask this question to evaluate the candidate’s contribution to the team or business success.
How to Answer:
Highlight the outcomes of a data project you managed successfully.
Sample Answer
I worked on a sales forecasting project to help the marketing team plan their campaigns better. I looked at past sales data to understand patterns and seasonal trends, then created a forecast to estimate demand for different product categories. Based on these insights, the team adjusted their campaign timing to match expected demand. This led to a 15% improvement in ROI and helped reduce inventory issues like overstocking or stock shortages.

Last-Minute Interview Preparation Checklist for Data Analysts
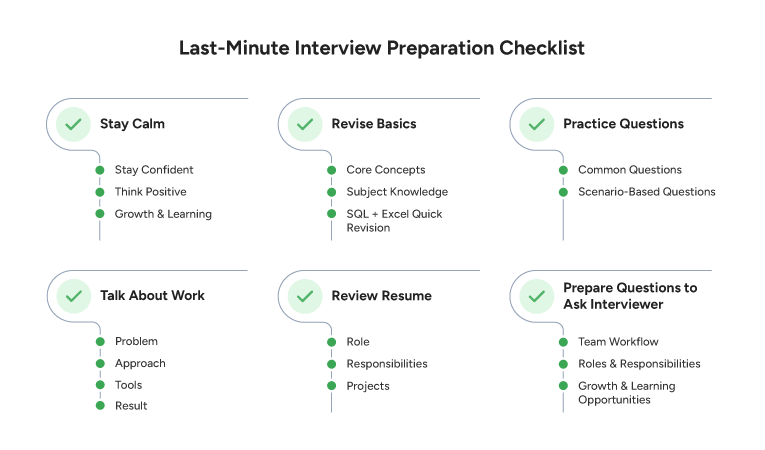
- Quickly revise the basics before your interview. Going in without preparation can make things harder, even if you know the subject.
- Practice common interview questions and keep your answers clear, honest, and to the point. Use simple examples to explain your thinking.
- Be ready to talk about your work such as what problem you worked on, how you approached it, which tools you used, and what result it created.
- Read your resume carefully and make sure you can confidently explain your role, responsibilities, and any projects you’ve listed.
- Prepare a few questions to ask the interviewer, such as about team workflow, tools, or upcoming projects. This shows genuine interest in the role.
- Stay calm and relaxed before the interview. Taking a deep breath and staying composed helps you think clearly and leave a good impression.
Read More Interview Questions with Sample Answer
Related Job Descriptions


Grow your business with factoHR today
Focus on the significant decision-making tasks, transfer all your common repetitive HR tasks to factoHR and see the things falling into their place.

© 2026 Copyright factoHR